Lisanslı kullanıma açıktır.
Lisans almak ve kullanmak için algoritmaborsa@gmail.com mail adresine lütfen mail atınız. Kullanım detayları ve ücret politikası sayfanın altında açıklanmıştır.
Tw Linki;
https://tr.tradingview.com/script/1uloJnwb/
Bu indikatör iki farklı yapıdaki sistemin birleştirilmesiyle ortaya çıkmıştır.
Uzun yıllardır kullanılan Nagants Izci ve Screener indikatörünün birleşimidir.
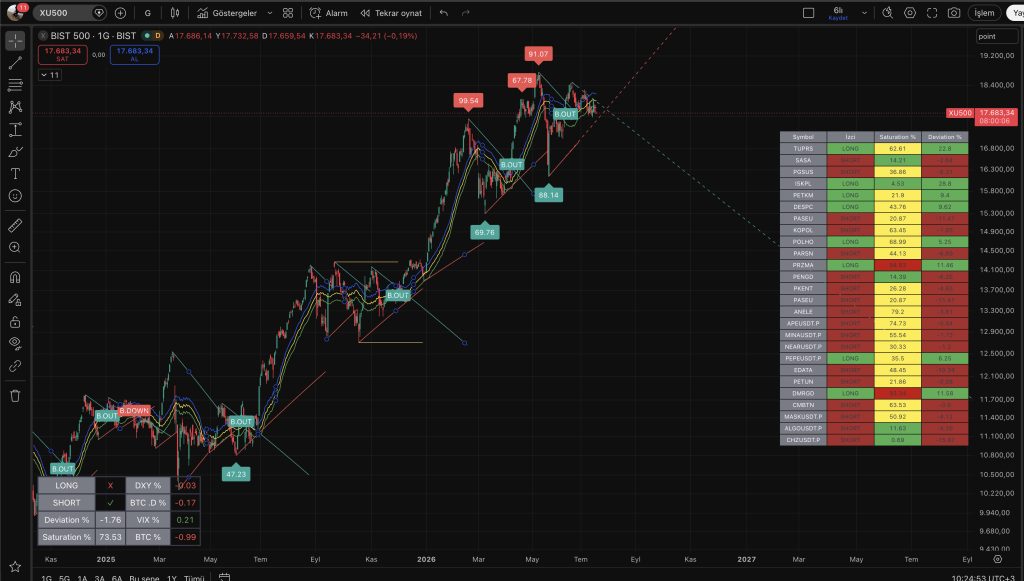
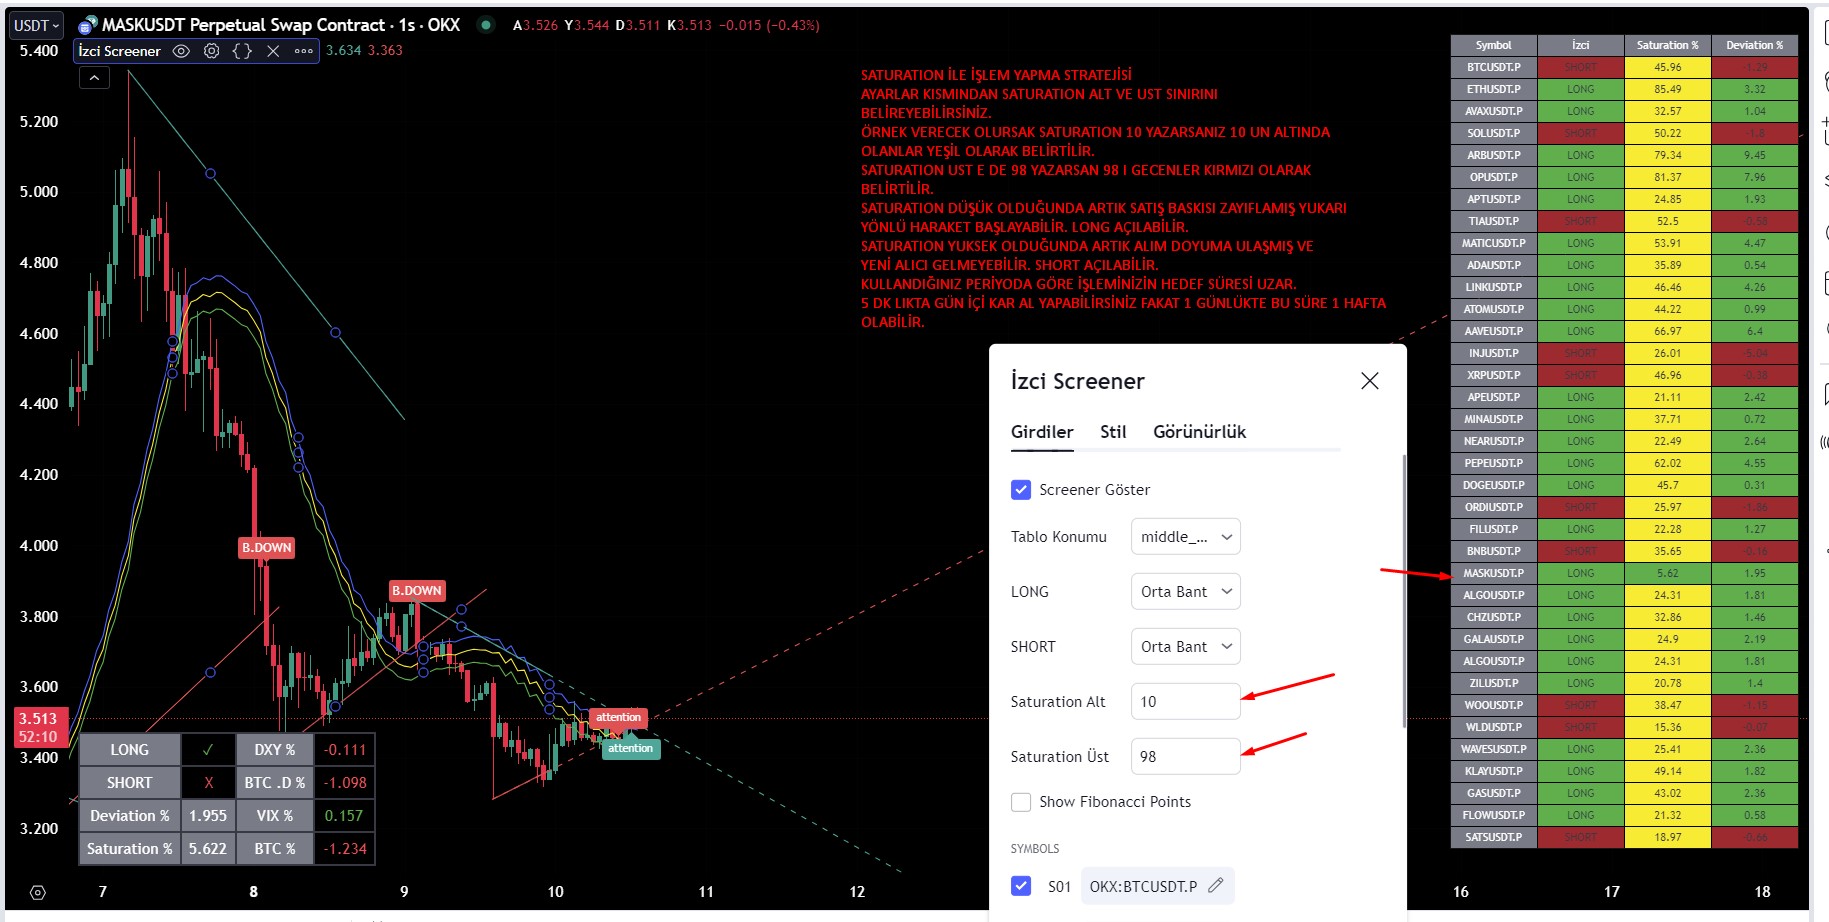
Nagants Izci Screener panelinde istediğiniz pariteyi seçerek bu paritenin İzci sistemine göre Long veya Short durumunda olduğunu ve bu durum değişikliğinin kaç bar önce gerçekleştiğini görebilirsiniz. Long ve Short durumunu ayarlardan belirleyebilirsiniz.
Ayarlar kısmında takip etmek istediğiniz 40 adet pariteyi seçebilirsiniz. Bu pariteler hisse senetleri, emtialar veya kripto paralar olabilir. Bu konuda bir sınırlama yoktur.
Saturation-doygunluk rakamlarını siz belirleyebilir ve buna göre işlem açabilirsiniz.
Screener panelinin grafiğin hangi alanında görmek isterseniz “tablo konumu” kısmından ayarlayabilirsiniz.
İsterseniz seçtiğiniz 40 adet farklı hisse senedini veya kripto parayı farklı periyotlarda çalıştırabilirsiniz. Bu sayede aynı anda 40 farklı hisseyi 40 farklı zaman periyodunda takip edebilirsiniz.
İzci indikatörü kullanıcıların trade ederken kazanç istatistiklerinin yükselmesine yardımcı
olmak amacıyla tasarlanmıştır.
İzci indikatörü temel olarak Ana hat, Üst hat ve alt hat olmak üzere 3 hat çizgisinden
oluşmaktadır.
İzci indikatörü nonlineer çapraz eşleşme yapılarak tasarlanmıştır, iki kullanım yöntemi vardır.
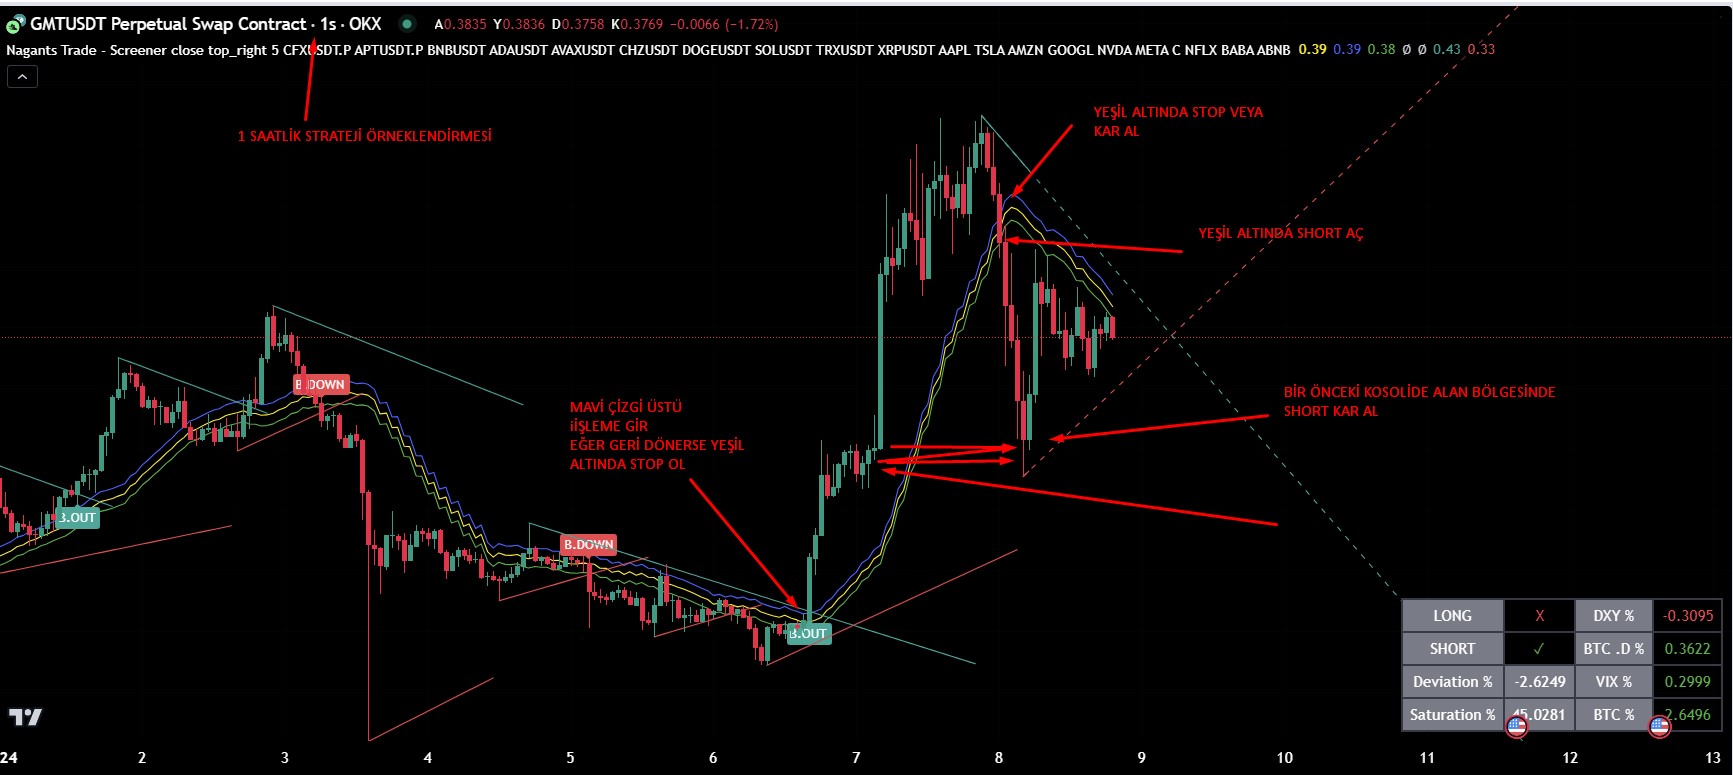
1. Kırılımları yakalamak için:
– Fiyat üst bandı kırarsa şiddetli yükselişler beklenebilir.
– Fiyat alt bandı kırarsa şiddetli düüşler beklenebilir.
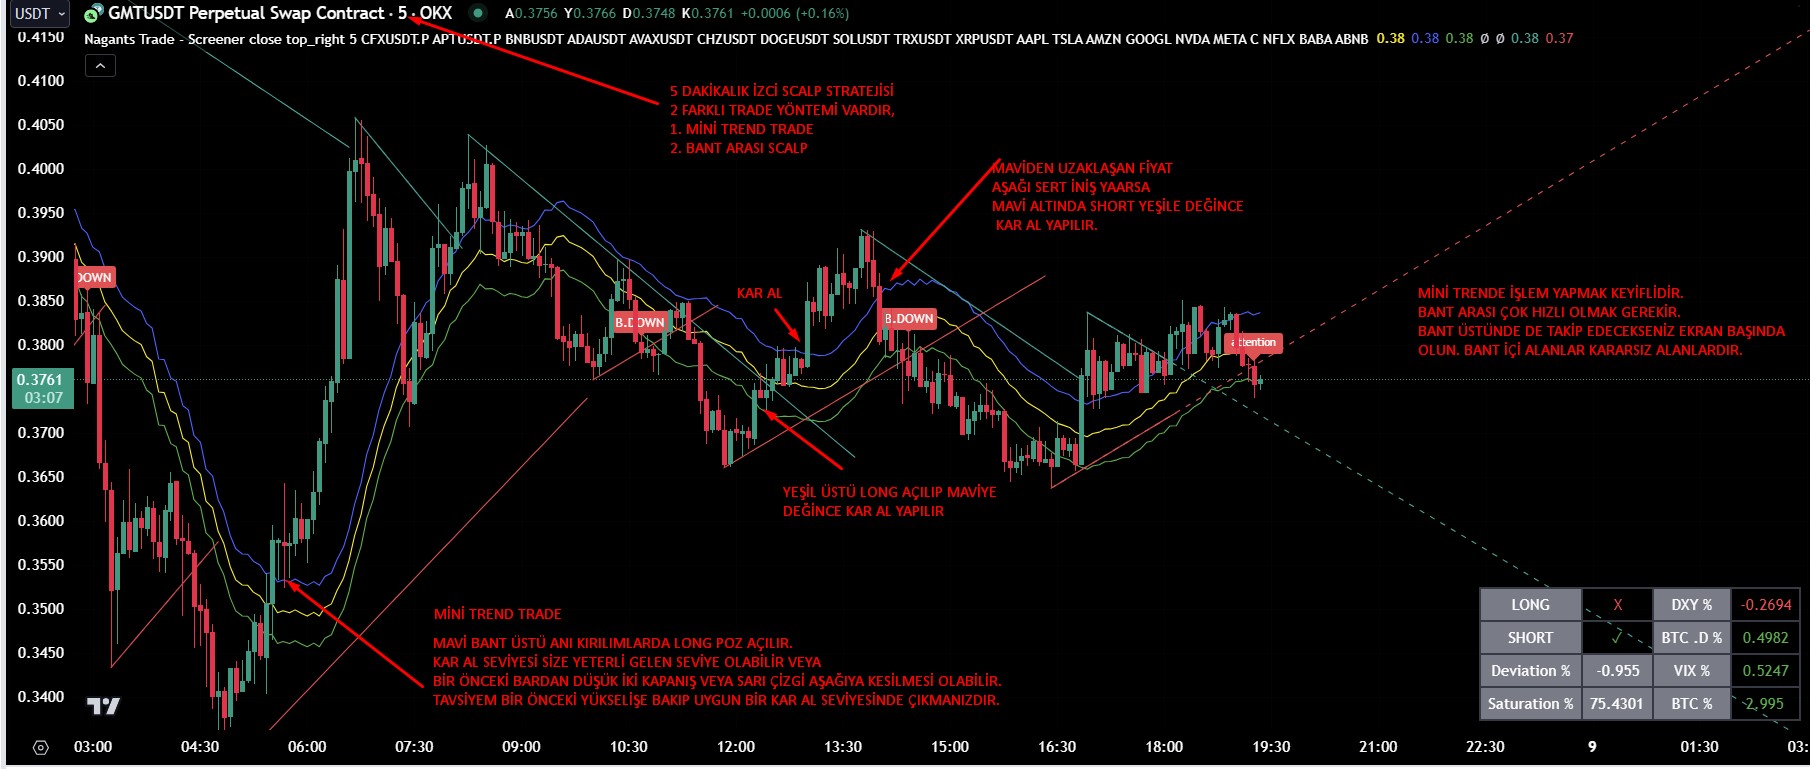
2. Bant içi hareketlerden yararlanmak için:
– Fiyat ana hat üzerinden yükselip üst banda değidiğinde long kar al yapılabilir.
– Fiyat ana hattın altına geçip alt banda değdiğinde short kar al yapılabilir.
İzci indikatörü ile trade ederken size yardımcı olabilecek iki farklı değer de grafikte
gözükmektedir.
Sapma değeri fiyatın ana hat çizgisinden yüzdesel olarak ne kadar uzaklaştığını gösterir.
Standartların dışında gördüğünüz sapma değerlerinde kar al yapmak mantıklıdır, kaybetme
riskinizi azaltır.
Doygunluk değeri fiyatın doyuma ulaşıp ulaşmadığını gösterir.
Doygunluğun 100 e yakın olması fiyatın artık doyuma ulaştığını gösterir fakat şiddetli trend
haraketlerinde belirli bir süre bu değer 100 e yakın seyredebilir.
Bu tip durumlarda çok dikkatli davranarak sapma değerine bakarak satış-alış kararı
verilmelidir.
Doygunluğun 0-20 arasında olması ise fiyatın düşüş haraketinin sönümlendiği anlamına
gelebilir.
Hiç bir indikatörün kesinliğinin olmadığı gibi bu indikatörün de bir kesinliği yoktur.
Amaç istatisksel olarak kazançlı işlem sayısını arttırmaktır.
“The Izci Indicator“ has been designed to help users to improve the earnings statistics of
their trading journey.
The izci indicator basically consists of 3 lines, The Main Line, The Top Line, and The Bottom
Line.
The Izci indicator has been designed by using the nonlinear cross-matching methodology.
There are two usage methods.
1. For catching the breakdowns:
– Sharp price increases can be expected if the price breaks the upper band,
– Sharp price decreases can be expected if the price breaks the lover band.
2. To take advantage of in-band movements;
– When the price rises over the main line and touches the upper band, long profits can
be made.
– When the price goes below the main line and touches the lower band, a short profit
can be made.
There are two different values on the chart aiming to help you when you use the Izci
Indicator.
The Deviation value shows how far the price has moved away from the baseline, as a
percentage. It makes sense to take profit in deflection you see outside the standards, it
reduces your risk of loss.
The saturation value indicates whether the price has reached saturation.
The fact that the saturation is close to 100 indicates that the price has reached saturation,
but in severe trend movements, this value may stay close to 100 for a certain period of time.
In such cases, a sale-buy decision should be made by being very careful and looking at the
deviation value.
If the saturation is between 0-20, it might mean that the downward movement of the price is
damped.
This indicator has no certainty just like the other indicators.
The aim of the Izci Indicator is to increase the number of statistically profitable transactions.
XU100 and XU030 values in the table are Turkish stock market / BIST data.
If desired, it can be presented by adding different countries or different data.
Tarama yapılacak koşulu birden fazla seçenekten oluşur.
İsterseniz üst veya alt bant kırılımlarına göre isterseniz doyum seviyesine göre tarama yaptırabilirsiniz.
Tarama yapılacak pariteler 4 grup halinde belirlenmiştir.
Özel liste oluşturabilir ve bu listeye 40 adet parite ekleyebilirsiniz.
Merhaba, Bu indikatörü lisanslı olarak kullanmak için yıllık (12 aylık)150 dolar lisans ücreti ödemeniz gerekmektedir.
Ücreti ödedikten sonra Tradingview kullanıcı adınızı dekont ile beraber bize mail atmanız yeterlidir. Sonrasında bu yazılım sizin kullanımınıza açılacaktır.
Bundan sonraki süreçteki geliştirmeler ücretsiz olacaktır.
Nagants Trade Screener yazılımı sınırlı sayıda kişinin kullanımına açılacaktır.
Belirli bir sayıya ulaştıktan sonra ise yeni kullanıcıya kapatılacaktır.
Önümüzdeki dönemlerde ise Nagants Trade Screener with Izci Coin indikatörünün kullanımına yönelik online eğitimler yapılacaktır.
Kullanıcı deneyimlerine göre geri bildirimler alarak bu yazılımları daha kullanışlı hale getirme amacında olacağız.
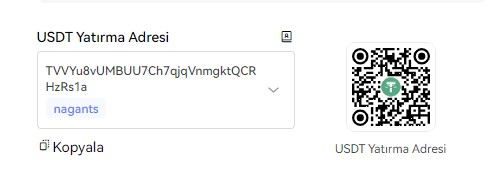
Ödeme yapacağınız Kripto para adresi;
USDT TRC20 Ağındaki adres;
TVVYu8vUMBUU7Ch7qjqVnmgktQCRHzRs1a
izci indikatörü kullanım videosu
https://youtu.be/e_Vmz0tWYkk?si=f1OsxOs7x9pXv9ds
https://youtu.be/3KtsUrKy8iQ?si=PsFIxp5KhffAaDGC
İşlem stratejileri
“The Izci Indicator“ has been designed to help users to improve the earnings statistics of
their trading journey.
The izci indicator basically consists of 3 lines, The Main Line, The Top Line, and The Bottom
Line.
The Izci indicator has been designed by using the nonlinear cross-matching methodology.
There are two usage methods.
1. For catching the breakdowns:
– Sharp price increases can be expected if the price breaks the upper band,
– Sharp price decreases can be expected if the price breaks the lover band.
2. To take advantage of in-band movements;
– When the price rises over the main line and touches the upper band, long profits can
be made.
– When the price goes below the main line and touches the lower band, a short profit
can be made.
There are two different values on the chart aiming to help you when you use the Izci
Indicator.
The Deviation value shows how far the price has moved away from the baseline, as a
percentage. It makes sense to take profit in deflection you see outside the standards, it
reduces your risk of loss.
The saturation value indicates whether the price has reached saturation.
The fact that the saturation is close to 100 indicates that the price has reached saturation,
but in severe trend movements, this value may stay close to 100 for a certain period of time.
In such cases, a sale-buy decision should be made by being very careful and looking at the
deviation value.
If the saturation is between 0-20, it might mean that the downward movement of the price is
damped.
This indicator has no certainty just like the other indicators.
The aim of the Izci Indicator is to increase the number of statistically profitable transactions.
XU100 and XU030 values in the table are Turkish stock market / BIST data.
If desired, it can be presented by adding different countries or different data.